SERVICES AND EXPERTISE
Data Dashboards with R Shiny Apps
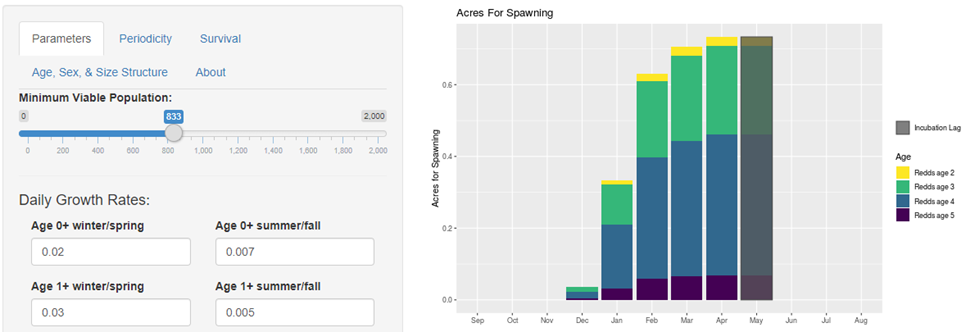
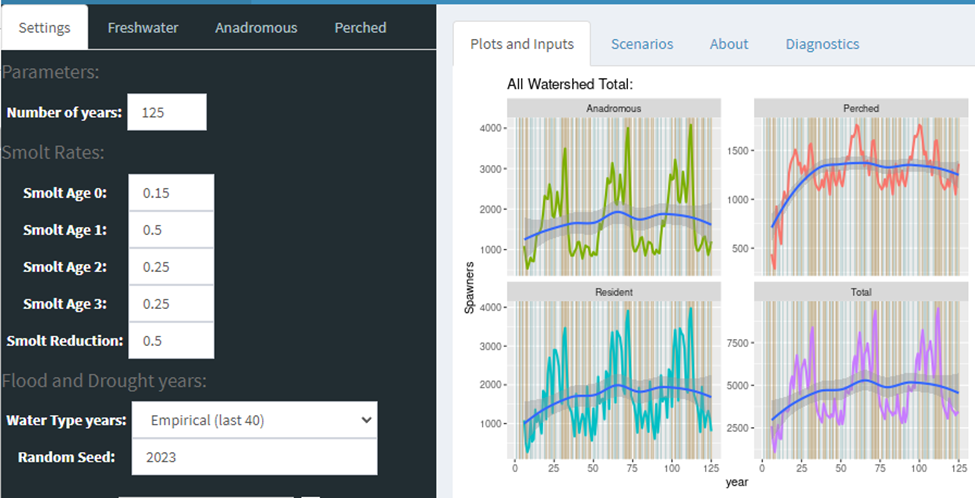
Shiny is a web application framework for R, a language and environment for statistical computing and graphics. Shiny makes it easy to turn R analyses into interactive web applications. This allows users to explore analyses, change input values, and make custom visualizations all without having to download any software or adjust R scripts. Some of the common off-the-shelf apps we provide include:
• Data Visualization: Interactive graphs, maps, and tables that allow querying and selection of data to display and download.
• Analysis Exploration: Dynamic inputs that allow users to change and adjust input data, initial conditions, or other assumptions to explore and rerun the analyses.
• Data QA\QC: Options for users to provide feedback and comments on data points, tables, maps, etc.
These off the shelf Shiny Apps are geared towards data delivery and transparency across multiple agencies, partners, and stakeholders. These are designed around a core set of customizable options to meet the desired outcomes related to specific project needs.
Some example Projects include


 (888) 224-1221
 Locations